The World & The Gap
Market Challenges
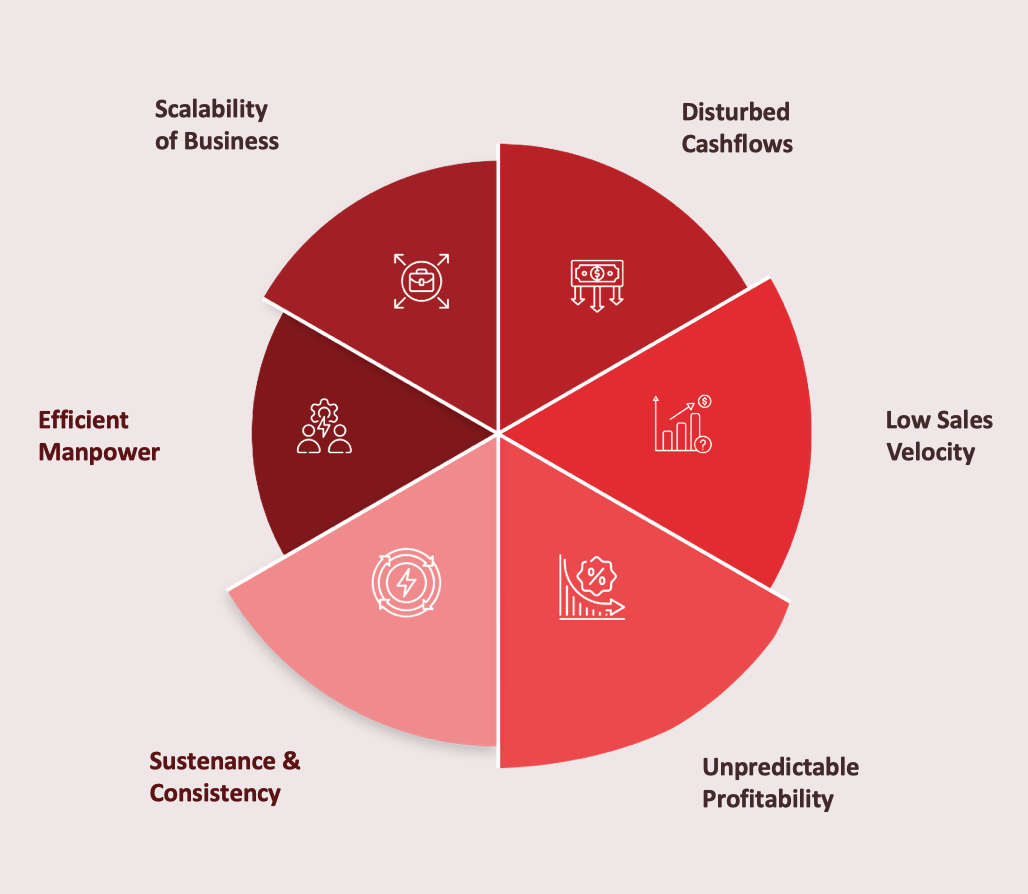
The Tier-2/3 Real Estate Crisis
Fragmented broker networks with overlapping efforts and inconsistent messaging

Localized buyer psychology vastly different from Tier-1 markets

12–18-month sales cycles creating inventory overhang and heavy carrying costs

Zero transparency across sales pipeline, lead quality, and performance metrics

Unprofessional service delivery eroding brand trust

Limited market penetration and market development

Lower ROI for customers and investors compared to Tier-1
Developer/Client Pain Points
Market Opportunity & Growth
-

India's real estate market is scaling from USD 570 billion in 2024 to USD 1+ trillion by 2030, opening unprecedented bandwidth for performance-driven consulting.
The 30 million housing unit deficit by 2030 represents a ₹67 trillion performance optimization opportunity across Tier-2/3 markets.
Tier 2-Cities Advantage
15-20%
High Growth Potential :
YoY increase in purchase intent and market activity
30-40%
Cost Efficiency :
lower operational cost vs Tier-1 cities
20%
Government Support :
Smart Cities Mission + rapid infra development
65%
Demographic Dividend :
population under 35 with rising disposable income
© 2025 Eighth P. All Rights Reserved. | Disclaimer | Privacy Policy
Disclaimer!
Except as expressly stated in these terms, this website and its contents are provided on an "as is" basis. Eighth P makes no representations or warranties of any kind, whether express or implied, including but not limited to warranties of merchantability, fitness for a particular purpose, or non-infringement. Eighth P shall not be held responsible for any loss, damage, claim, or liability arising from (a) any errors or omissions in the website or its content, including typographical or technical inaccuracies, (b) any third-party websites or content accessed through links provided on this website, (c) any temporary unavailability or interruption of this website, (d) your use or reliance on any information provided herein, or (e) any issues related to the use of your hardware, software, or internet connection in accessing this website.